Hi Yeray,
Method EnsureRange is necessary for restriction of height TBitMap. The matter is that TBitMap. Height> = 0. And she cannot be negative. And then, what for to us to Draw there where all the same it is not visible? Therefore I have made check of Value with restrictions
Code: Select all
EnsureRange (B.Heigth, 0, Chart1.Heigth);
If B.Heigth <0 the result of function will be 0.
If b. Heigth> Chart1.Heigth the result of function will be Chart1.Heigth,
If 0 <= b. Heigth <=Chart1.Heigth the result of function will be b. Heigth.
Apropos? :
Code: Select all
b2.Height: = EnsureRange (Ser. CalcYPos (j), 0, Ser. ParentChart. Height)
                 - EnsureRange (Ser. CalcYPos (j - 1), 0, Ser. ParentChart. Height);
I at first at all have not understood why you have asked it, yet has not created Chart dynamically.
I have forgotten, that I have made preliminary options TChart, namely Chart1.LeftAxis. Inverted: = true;
Now, that the previous expression became more correct, it is necessary to take this expression on the module:
Code: Select all
b2.Height: = ABS (EnsureRange (Ser. CalcYPos (j - 1), 0, Ser. ParentChart. Height)
                 - EnsureRange (Ser. CalcYPos (j), 0, Ser. ParentChart. Height));
The given expression protects from error occurrence at use of methods Zoom.
What for I have created third Series?
In Series3 it is brought data adhered to axis Y, and in X the code of a picture from the directory is brought for example, or we use value Labels.
For example
Code: Select all
Series3.Addxy (1,1, ' C:\Limestone.bmp ');
Series3.Addxy (2,2, ' C:\Dolomite.bmp ');
Series3.Addxy (3,1, ' C:\Limestone.bmp ');
Series3.Addxy (10,3, ' C:\Clay.bmp ');
When I wrote the following code:
Code: Select all
b2.Canvas. Brush. Color: = Round (Ser. XValues [j]) *1000;
b2.Canvas. FillRect (Rect (0, 0, b2.Width, b2.Height));
I wished to show only idea which has come to to me mind for the decision of the given problem.
Why I have hidden Series. Pen. Visible: = false?
To display her on the screen it is not necessary. She serves only as the container for storage of the adhered information. This line is convenient for using at position calculations on axis Y or X.
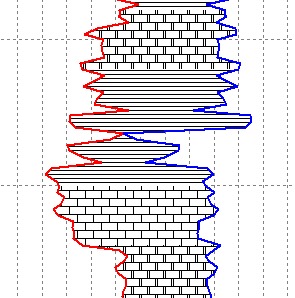
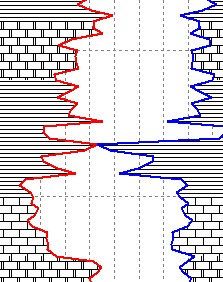
That all has risen on the places, I suggest to look the corrected variant:
Code: Select all
procedure TForm1.BitBtn1Click (Sender: TObject);
Var
  j: Integer;
  x, y: Double;
begin
  MYChart: = TChart. Create (Self);
  MYChart. Parent: = Self;
  MYChart. OnBeforeDrawSeries: = Chart1BeforeDrawSeries;
  MYChart. View3D: = False;
  MYChart. LeftAxis. Inverted: = true;
  MYChart. Legend. Visible: = False;
  y: = 0;
  MYChart. Tools. Add (TSeriesBandTool. Create (nil));
  MYChart. AddSeries (THorizLineSeries. Create (nil));
  MYChart. AddSeries (THorizLineSeries. Create (nil));
  MYChart. AddSeries (THorizLineSeries. Create (nil));
  (MYChart. Tools [0] as TSeriesBandTool).Series: = MYChart [0];
  (MYChart. Tools [0] as TSeriesBandTool).Series2: = MYChart [1];
  MYChart [2].Pen. Visible: = false;
  MYChart. LeftAxis. SetMinMax (0,20);
  for j: = 0 to 9 do
  begin
    x: = Random * 10 + 10;
    MYChart [0].AddXY (x, y, ", clRed);
    x: = random * 10 + 20;
    MYChart [1].AddXY (x, y, ", clBlue);
    MYChart [2].AddXY (j, y);
    y: = y + 1;
  end;
end;

procedure TForm1.MyDraw (Sender: TObject);
Var
  j, OldHeigth: Integer;
  B, B2: TBitMap;
  Ser: THorizLineSeries;
begin
    Ser: = THorizLineSeries (Sender);
    B: = TBitMap. Create;
    try
      B.Width: = 10;
      b. Height: = EnsureRange (Ser. CalcYPos (0), 0, Ser. ParentChart. Height);
      for j: = 1 to Ser. Count-1 do
      begin
            B2: = TBitMap. Create;
            try
              b2.Width: = B.Width;
              //b2.Height: = ABS (Ser. CalcYPos (j - 1) - Ser. CalcYPos (j))
              {Metod EnsureRange}
              b2.Height: = ABS (EnsureRange (Ser. CalcYPos (j - 1), 0, Ser. ParentChart. Height)
                - EnsureRange (Ser. CalcYPos (j), 0, Ser. ParentChart. Height));
              {Here it is possible to make anything you like.}
              b2.Canvas. Brush. Color: = Round (Ser. XValues [j]) *1000;
              b2.Canvas. FillRect (Rect (0, 0, b2.Width, b2.Height));

              OldHeigth: = b. Height;
              b. Height: = b. Height + b2.Height;
              b. Canvas. Draw (0, OldHeigth, b2);
            Finally
              B2.Free;
            end;
      end;
      (MYChart. Tools [0] as TSeriesBandTool).Brush. Image. Assign (b);
    finally
      b. Free;
    end;
end;

procedure TForm1.Chart1BeforeDrawSeries (Sender: TObject);
begin
  if MYChart. SeriesCount = 3 then
    MyDraw (MYChart [2]);
end;