
Can multiple colors be shown FastLine ?
An example image below .
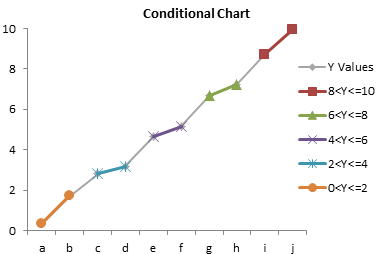
Please provide .net example how this can be achieved using TeeChart?
Thanks
Andy
Code: Select all
      List<int> valList;
      List<Color> colorList;
      private void InitializeChart()
      {
        tChart1.Aspect.View3D = false
		tChart1.Header.Visible = true;
        tChart1.Panning.Allow = Steema.TeeChart.ScrollModes.Horizontal;
        FastLine myCustomLine = new FastLine(tChart1.Chart);
        myCustomLine.LinePen.Width = 3;
        myCustomLine.Marks.Visible = true;
        myCustomLine.ColorEach = true;
        valList = new List<int>(new int[] { 81, 81, 81, 13, 13, 13, 13, 53 });
        colorList = new List<Color>(new Color[] { Color.Red, Color.Green, Color.Blue, Color.HotPink, Color.Black, Color.Purple, Color.Magenta, Color.Cyan });
        int index = 0;
          foreach (int val in valList)
          {
		   myCustomLine.Add(index, val, "", colorList[index]);
           index++;
          }

}Code: Select all
     List<int> valList;
      List<Color> colorList;
      private void InitializeChart()
      {
          tChart1.Aspect.View3D = false;

          tChart1.Header.Visible = true;
          tChart1.Panning.Allow = Steema.TeeChart.ScrollModes.Horizontal;
          Line myCustomLine = new Line(tChart1.Chart);

          myCustomLine.Pointer.Visible = true;
          myCustomLine.Pointer.Style = Steema.TeeChart.Styles.PointerStyles.DownTriangle;
          myCustomLine.Pointer.Color = Color.Red;
          myCustomLine.Pointer.HorizSize = 4;
          myCustomLine.Pointer.VertSize = 4;
          myCustomLine.Pointer.Visible = true;
          myCustomLine.Pointer.Pen.Visible = false;

          myCustomLine.LinePen.Width = 3;
          myCustomLine.LinePen.Width = 3;

          myCustomLine.Marks.Visible = true;
          myCustomLine.ColorEachLine = true;
          ((Steema.TeeChart.Styles.Line)this.tChart1[0]).Color = Color.Green;
          myCustomLine.GetPointerStyle += new Steema.TeeChart.Styles.CustomPoint.GetPointerStyleEventHandler(myCustomLine_GetPointerStyle);

          valList = new List<int>(new int[] { 81, 81, 81, 13, 13, 13, 13, 53 });
          colorList = new List<Color>(new Color[] { Color.Red, Color.Green, Color.Blue, Color.HotPink, Color.Black, Color.Purple, Color.Magenta, Color.Cyan });
          int index = 0;

          foreach (int val in valList)
          {
              myCustomLine.Add(index, val, "", colorList[index]);
              index++;
          }

      }
      void myCustomLine_GetPointerStyle(Steema.TeeChart.Styles.CustomPoint series, Steema.TeeChart.Styles.GetPointerStyleEventArgs e)
      {// Get the Data Quality lists for this series...
          Line dqSeries = series as Line;

          if (dqSeries != null)
          {
              if (e.ValueIndex != -1)
              {
                  int nextIndex = e.ValueIndex;
                  if (nextIndex < (series.LastVisibleIndex + 1))
                  {
                      e.Color = colorList[nextIndex];
                  }
              }
          }
      }
| Sandra Pazos / Development & Support Steema Software Avinguda Montilivi 33, 17003 Girona, Catalonia Tel: 34 972 218 797 http://www.steema.com |
      |
| Instructions - How to post in this forum |
Code: Select all
myCustomLine.Add(index, val, "", colorList[index]); Code: Select all
            myCustomLine.DefaultNullValue = double.NegativeInfinity;
            myCustomLine.TreatNulls = TreatNullsStyle.DoNotPaint;
Code: Select all
        private void InitializeChart()
        {
            tChart1.Aspect.View3D = false;
            _series1 = new Steema.TeeChart.WPF.Styles.Line(tChart1.Chart);
            Random rnd = new Random();
            for (int i = 0; i < 10; i  )
            {
                if (i < 5)
                {
                    _series1.Add(i, rnd.Next(100), Colors.Red);
                }
                else
                {
                    _series1.Add(i, rnd.Next(100), Colors.Black);
                }
            }
            _series1.Pointer.Visible = true;
            BitmapSource bitmap = tChart1.Chart.Bitmap(tChart1.Width, tChart1.Height);
            _series1.GetPointerStyle  =new CustomPoint.GetPointerStyleEventHandler(series1_GetPointerStyle);

        }
        void series1_GetPointerStyle(CustomPoint series, GetPointerStyleEventArgs e)
        {

                if (e.ValueIndex == 0 || e.ValueIndex == 4)
                {
                    e.Color = Colors.Red;
                    series.Pointer.Pen.Color = e.Color;
                    e.Style = PointerStyles.Circle;
                }
                else if (e.ValueIndex == 5 || e.ValueIndex == 9)
                {
                    e.Color = Colors.Black;
                    series.Pointer.Pen.Color = e.Color;
                    e.Style = PointerStyles.Circle;
                }
                else
                {
                    e.Color = Colors.Transparent;
                    series.Pointer.Pen.Color = e.Color;
                }
}| Sandra Pazos / Development & Support Steema Software Avinguda Montilivi 33, 17003 Girona, Catalonia Tel: 34 972 218 797 http://www.steema.com |
| |
| Instructions - How to post in this forum |
Code: Select all
series.TreatNulls = TreatNullsStyle.DoNotPaint;Code: Select all
series.Add(x, y, Colors.Red)Code: Select all
        Steema.TeeChart.WPF.Styles.Line _series1;
        private void InitializeChart()
        {
            tChart1.Aspect.View3D = false;
            _series1 = new Steema.TeeChart.WPF.Styles.Line(tChart1.Chart);
            _series1.DefaultNullValue = double.NegativeInfinity;
            _series1.TreatNulls = TreatNullsStyle.DoNotPaint;
            Random rnd = new Random();
            for (int i = 0; i < 10; i++)
            {
                if (i < 5)
                {
                    _series1.Add(i, rnd.Next(100), Colors.Red);
                }
                else
                {
                    _series1.Add(i, rnd.Next(100), Colors.Black);
                }
            }
             _series1.SetNull(7);
            _series1.Pointer.Visible = true;

            BitmapSource bitmap = tChart1.Chart.Bitmap(tChart1.Width, tChart1.Height);
            _series1.GetPointerStyle +=new CustomPoint.GetPointerStyleEventHandler(series1_GetPointerStyle);

        }
        void series1_GetPointerStyle(CustomPoint series, GetPointerStyleEventArgs e)
        {

                if (e.ValueIndex == 0 || e.ValueIndex == 4)
                {
                    e.Color = Colors.Red;
                    series.Pointer.Pen.Color = e.Color;
                    e.Style = PointerStyles.Circle;
                }
                else if (e.ValueIndex == 5 || e.ValueIndex == 9)
                {
                    e.Color = Colors.Black;
                    series.Pointer.Pen.Color = e.Color;
                    e.Style = PointerStyles.Circle;
                }
                else
                {
                    e.Color = Colors.Transparent;
                    series.Pointer.Pen.Color = e.Color;
                }

        }
Sorry, but I am not sure which behavior you expect of GetPointerStyle. Could you tell us, how you think GetPointerStyle should be worked?You are About GetPointerStyle; it would be nice I can get hold of "Value Object" from GetPointerStyleEventArgs not only "ValueIndex".
| Sandra Pazos / Development & Support Steema Software Avinguda Montilivi 33, 17003 Girona, Catalonia Tel: 34 972 218 797 http://www.steema.com |
| |
| Instructions - How to post in this forum |
Code: Select all
        private void InitializeChart()
        {
            Line lineSeries;
            Points points;

            DownSampling downSampling;

            tChart1.Axes.Bottom.Automatic = true;
            tChart1.Axes.Bottom.Labels.ValueFormat = string.Empty;
            tChart1.Aspect.View3D = false;
            tChart1.Legend.Visible = false;
            tChart1.Aspect.ClipPoints = false;
            tChart1.Zoom.Allow = false;
            tChart1.Axes.Left.Automatic = true;

            tChart1.Zoom.Direction = ZoomDirections.Horizontal;

            points = new Points(tChart1.Chart);
            lineSeries = new Line(tChart1.Chart);
            downSampling = new DownSampling(tChart1.Chart);

            points.DefaultNullValue = double.NegativeInfinity;


            points.ColorEach = true;
            var rnd = new Random();

            for (int index = 0; index < 50000; index++)
            {
                //for 1001 to 1999 make Colors.Transparent
                if (index > 1000 & index < 2000)
                    points.Add(index, rnd.Next(20,30), Colors.Transparent);
                //for 5001 to 19999 make Colors.Black
                else if (index > 5000 & index < 20000)
                    points.Add(index, rnd.Next(10, 20), Colors.Black);
                //for rest make Colors.Red
                else
                    points.Add(index, rnd.Next(30, 40), Colors.Red);

            }
            //mark 1001 to 1999 as null
            for (var i = 0; i < 1000; i++)
            {
                points.SetNull(i+1000);
            }
            lineSeries.Pointer.Visible = true;
            points.Active = false;

            downSampling.DisplayedPointCount = 500;
            downSampling.Method = DownSamplingMethod.MinMaxFirstLastNull;
            lineSeries.TreatNulls = TreatNullsStyle.DoNotPaint;
            lineSeries.LinePen.Width = 2;
            lineSeries.ColorEach = true;


            lineSeries.DataSource = points;
            lineSeries.Function = downSampling;
            var bitmap = tChart1.Chart.Bitmap(tChart1.Width, tChart1.Height);
            lineSeries.GetPointerStyle += new CustomPoint.GetPointerStyleEventHandler(lineSeries_GetPointerStyle);


        }

        void lineSeries_GetPointerStyle(CustomPoint series, GetPointerStyleEventArgs e)
        {
            // how to find first and last valueIndex of visible points
            if (e.ValueIndex == 1001 || e.ValueIndex == 1999)
            {
                e.Color = Colors.Red;
                series.Pointer.Pen.Color = e.Color;
                e.Style = PointerStyles.Circle;
            }
            else if (e.ValueIndex == 5001 || e.ValueIndex == 19999)
            {
                e.Color = Colors.Black;
                series.Pointer.Pen.Color = e.Color;
                e.Style = PointerStyles.Circle;
            }
            else
            {
                e.Color = Colors.Transparent;
                series.Pointer.Pen.Color = e.Color;
            }
        }
Code: Select all
        public MainWindow()
        {
            InitializeComponent();
            InitializeChart();
        }

        private void InitializeChart()
        {
            Steema.TeeChart.WPF.Styles.Line lineSeries;
            Points points;

            Steema.TeeChart.WPF.Functions.DownSampling downSampling;

            tChart1.Axes.Bottom.Automatic = true;
            tChart1.Axes.Bottom.Labels.ValueFormat = string.Empty;
            tChart1.Aspect.View3D = false;
            tChart1.Legend.Visible = false;
            tChart1.Aspect.ClipPoints = false;
            tChart1.Zoom.Allow = false;
            tChart1.Axes.Left.Automatic = true;


             tChart1.Zoom.Direction = Steema.TeeChart.ZoomDirections.Horizontal;

            points = new Points(tChart1.Chart);
            lineSeries = new Steema.TeeChart.WPF.Styles.Line(tChart1.Chart);
            downSampling = new Steema.TeeChart.WPF.Functions.DownSampling(tChart1.Chart);

            points.DefaultNullValue = double.NegativeInfinity;


            points.ColorEach = true;
            var rnd = new Random();

            for (int index = 0; index < 50000; index++)
            {
                //for 1001 to 1999 make Colors.Transparent
                if (index > 1000 & index < 2000)
                    points.Add(index, rnd.Next(20, 30), Colors.Transparent);
                //for 5001 to 19999 make Colors.Black
                else if (index > 5000 & index < 20000)
                    points.Add(index, rnd.Next(10, 20), Colors.Black);
                //for rest make Colors.Red
                else
                    points.Add(index, rnd.Next(30, 40), Colors.Red);

            }
            //  points.Visible = true;
            //mark 1001 to 1999 as null
            for (var i = 0; i < 1000; i++)
            {
                points.SetNull(i + 1000);
            }

            lineSeries.DataSource = points;
            lineSeries.Function = downSampling;
            lineSeries.Pointer.Visible = true;
            points.Active = false;

            downSampling.DisplayedPointCount = 500;
            downSampling.Method = Steema.TeeChart.WPF.Functions.DownSamplingMethod.MinMaxFirstLastNull;
            lineSeries.TreatNulls = TreatNullsStyle.DoNotPaint;
            lineSeries.LinePen.Width = 2;
            lineSeries.ColorEach = true;
            lineSeries.GetPointerStyle += new CustomPoint.GetPointerStyleEventHandler(lineSeries_GetPointerStyle);
            var bitmap = tChart1.Chart.Bitmap(tChart1.Width, tChart1.Height);
        }

        void lineSeries_GetPointerStyle(CustomPoint series, GetPointerStyleEventArgs e)
        {
            // how to find first and last valueIndex of visible points
            if (e.ValueIndex == 101 || e.ValueIndex == 199)
            {
                e.Color = Colors.Red;
                series.Pointer.Pen.Color = e.Color;
                e.Style = PointerStyles.Circle;
                series[e.ValueIndex].Color = e.Color;
            }
            else if (e.ValueIndex == 401 || e.ValueIndex == 499)
            {
                e.Color = Colors.Black;
                series.Pointer.Pen.Color = e.Color;
                e.Style = PointerStyles.Circle;

                series[e.ValueIndex].Color = e.Color;
            }
            else
            {
                e.Color = Colors.Transparent;
                series.Pointer.Pen.Color = e.Color;
            }
        }
| Sandra Pazos / Development & Support Steema Software Avinguda Montilivi 33, 17003 Girona, Catalonia Tel: 34 972 218 797 http://www.steema.com |
| |
| Instructions - How to post in this forum |
Code: Select all
            for (int index = 0; index < 50000; index++)
            {
                //for 1001 to 1999 make Colors.Transparent
                if (index > 1000 & index < 2000)
                    points.Add(index, rnd.Next(20, 300), Colors.Transparent);
                //for 5001 to 19999 make Colors.Black
                else if (index > 5000 & index < 20000)
                    points.Add(index, rnd.Next(10, 200), Colors.Black);
                //for rest make Colors.Red
                else
                    points.Add(index, rnd.Next(30, 100), Colors.Red);

            }
| Sandra Pazos / Development & Support Steema Software Avinguda Montilivi 33, 17003 Girona, Catalonia Tel: 34 972 218 797 http://www.steema.com |
| |
| Instructions - How to post in this forum |

| Narcís Calvet / Development & Support Steema Software Avinguda Montilivi 33, 17003 Girona, Catalonia Tel: 34 972 218 797 http://www.steema.com |
| |
| Instructions - How to post in this forum |