Chart shows a dip when including decimals

TeeChart VCL for Borland/CodeGear/Embarcadero RAD Studio, Delphi and C++ Builder.
Post Reply
Ed Dressel
Newbie
Newbie
Posts: 16
Joined: Wed Aug 16, 2023 12:00 am

Chart shows a dip when including decimals

Post by Ed Dressel » Wed Apr 09, 2025 7:38 pm

D12.2, TChart 24.42
In a chart I needed, I could not get a stacked area chart to work, so I add the values of previous series to the new series point. Also, when a value goes to zero, I step it down, so that the chart goes straight to zero.

The chart works fine when I don't use decimal values:

Image

But when I add decimals, it adds a second step down in the 20th year, and appears incorrectly:

Image

The step down code is something I got from Steema years ago (a bit modified).

The attached demo reproduces this--simply check/uncheck the "Include Decimals" checkbox.

How do I avoid the problem with the second chart?

Thank you,

Ed Dressel
Attachments
Batch Gap Rendering.zip
(76.54 KiB) Downloaded 66 times

Yeray
Site Admin
Site Admin
Posts: 9663
Joined: Tue Dec 05, 2006 12:00 am
Location: Girona, Catalonia
Contact:

Re: Chart shows a dip when including decimals

Post by Yeray » Fri Apr 11, 2025 11:06 am

Hello,

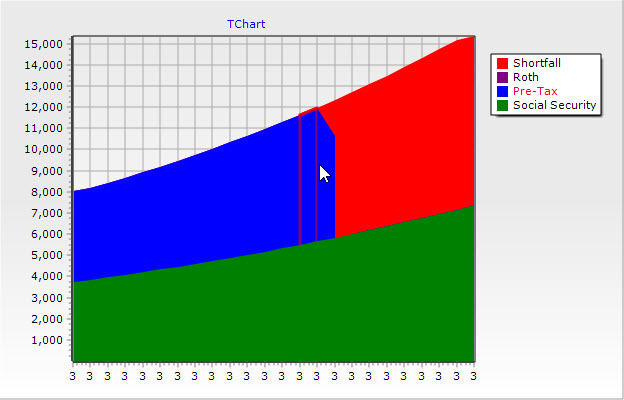
Looking at the final data in the series I see at the index 18, instead of reusing the preceding value (index 17), it takes the value of a couple of indices above (index 15):
JFKUAgWmmP.png
JFKUAgWmmP.png (79.73 KiB) Viewed 1636 times
If you debug the final lChartStepDowns loop, where you add the repeated values, you'll see you are getting the stepDowns for values 8, 5 and 15, in that order.
- Adding a repeated value for the 8 affects the indexes >8. Ok.
- Adding a repeated value for the 5 affects the indexes >5. The operation above didn't affect this. Ok.
- Adding a repeated value for the 15 affects the indexes >15. The operations above affect this because now at the index 15 you have the XValue 13 and YValue 11.627.45.

To fix this, you only have to sort the lChartStepDowns before the loop so you add repeated loops from the end:

Code: Select all

uses Generics.Defaults;

var IntegerComparer: IComparer<Integer>;

function CompareStepDowns(const ALeft, ARight: TChartStepDown): Integer;
begin
  Result:=IntegerComparer.Compare(ALeft.FX, ARight.FX);
end;

procedure TForm2.UpdateChart(aChart: TChart);
//...
var
  Comparer: IComparer<TChartStepDown>;
  //...
    Comparer:=TComparer<TChartStepDown>.Construct(CompareStepDowns);
    lChartStepDowns.Sort(Comparer);

    for I := lChartStepDowns.Count-1 downto 0 do begin
      lChartStepDown := lChartStepDowns[I];
      //...
end;
Best Regards,
ImageYeray Alonso
Development & Support
Steema Software
Av. Montilivi 33, 17003 Girona, Catalonia (SP)
Image Image Image Image Image Image Please read our Bug Fixing Policy

Ed Dressel
Newbie
Newbie
Posts: 16
Joined: Wed Aug 16, 2023 12:00 am

Re: Chart shows a dip when including decimals

Post by Ed Dressel » Fri Apr 11, 2025 2:09 pm

Thank you! That works perfectly.

Post Reply